




Understanding CrystalDiskMark, ATTO, AS SSD, and the Real Meaning Behind Benchmark Numbers
If you’ve ever looked at SSD reviews, product specifications, or benchmark screenshots, you’ve probably noticed something confusing: 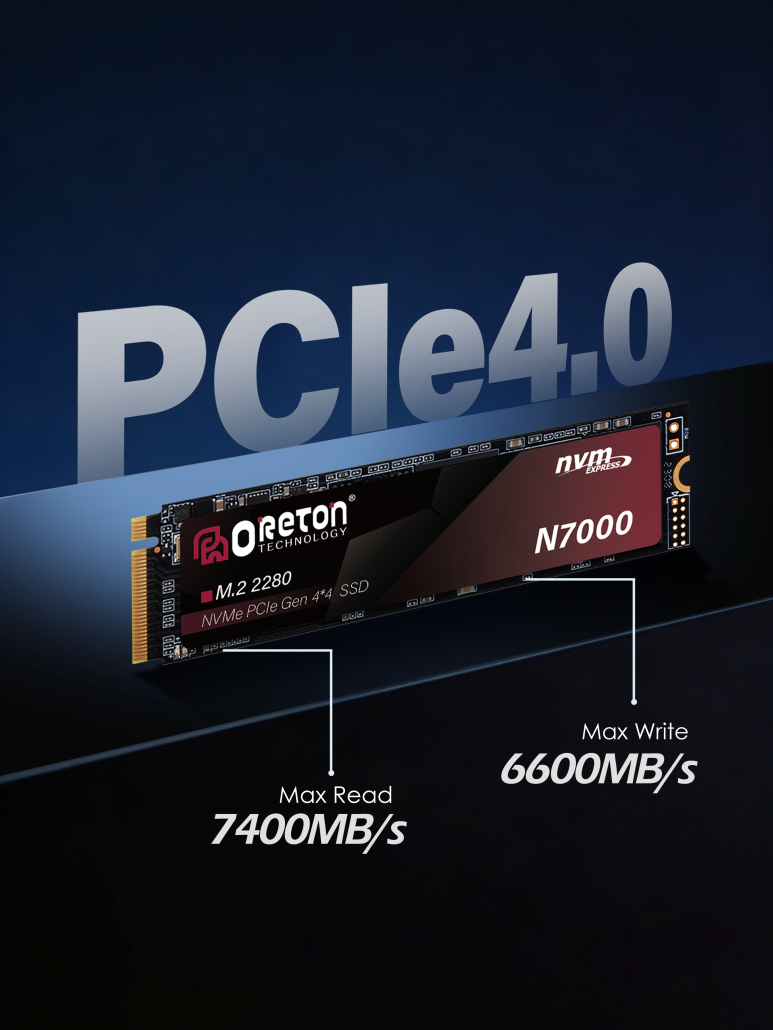
The same SSD might achieve 7,400 MB/s in one test, 6,800 MB/s in another, and an entirely different score in a third benchmark.
So which result is correct?
The answer is that they all can be correct.
SSD performance is not measured through a single universal test. Different benchmark tools use different workloads, file sizes, queue depths, compression methods, and testing conditions. As a result, the numbers can vary significantly—even when testing the exact same drive.
Understanding how SSD performance is measured can help you make better purchasing decisions, interpret benchmark results more accurately, and avoid being misled by marketing numbers.
Why SSD Performance Numbers Can Be Misleading
Most SSD specifications highlight two numbers:
- Sequential Read Speed
- Sequential Write Speed
For example:
| SSD | Sequential Read | Sequential Write |
|---|---|---|
| PCIe 4.0 NVMe SSD | 7,000 MB/s | 6,500 MB/s |
| PCIe 5.0 NVMe SSD | 14,000 MB/s | 12,000 MB/s |
These figures are usually achieved under highly controlled laboratory conditions.
However, real-world workloads rarely resemble these ideal scenarios.
When opening applications, launching games, booting Windows, or searching through files, your SSD is often performing thousands of small read and write operations rather than transferring a single massive file.
This is why benchmark results should always be viewed within the context of how they were measured.
The Key Metrics Used in SSD Testing
Before comparing benchmark tools, it’s important to understand what they are actually measuring.
Sequential Performance
Sequential performance measures how quickly an SSD can read or write large continuous blocks of data.
Examples:
- Copying a large video file
- Transferring game installation packages
- Moving backup archives
This is typically the headline number used in product marketing.
Random Performance
Random performance measures how quickly an SSD can access many small files located in different areas of the drive.
Examples:
- Operating system booting
- Application launching
- Game asset loading
- Database operations
For many everyday tasks, random performance has a greater impact on perceived responsiveness than sequential speed.
Queue Depth (QD)
Queue Depth refers to how many commands are waiting to be processed simultaneously.
Common values include:
- QD1
- QD4
- QD32
Consumer workloads often operate at lower queue depths, while enterprise workloads may operate at much higher levels.
An SSD may perform exceptionally at QD32 but show smaller advantages at QD1.
Latency
Latency measures how long it takes for the SSD to respond to a request.
Lower latency often contributes more to system responsiveness than higher maximum throughput.
CrystalDiskMark: The Most Popular SSD Benchmark
Among PC enthusiasts, CrystalDiskMark is probably the most widely used SSD testing tool.
What It Measures
CrystalDiskMark focuses on:
- Sequential Read
- Sequential Write
- Random Read
- Random Write
- Multiple Queue Depths
It provides a broad overview of SSD capabilities.
Why Manufacturers Like It
CrystalDiskMark is easy to understand and widely recognized.
Many published SSD specifications are based on testing methodologies similar to CrystalDiskMark.
As a result, benchmark screenshots are often used in marketing materials and product reviews.
Strengths
✔ Easy to use
✔ Widely accepted
✔ Good for comparing SSDs
✔ Measures both sequential and random workloads
Limitations
CrystalDiskMark uses synthetic workloads.
Real-world applications may not behave exactly like the benchmark.
A drive that scores higher in CrystalDiskMark does not always feel noticeably faster during daily use.
ATTO Disk Benchmark: The Traditional Industry Standard
Long before NVMe became mainstream, ATTO was one of the most commonly used SSD benchmarking tools.
Many manufacturers still rely on ATTO results when publishing specifications.
How ATTO Works
ATTO measures performance across multiple transfer sizes.
Instead of testing only one block size, it evaluates:
- 512 bytes
- 4 KB
- 64 KB
- 1 MB
- Larger transfer blocks
This allows users to see how performance scales as workloads change.
Why ATTO Often Produces Higher Numbers
One reason ATTO frequently reports impressive speeds is that it uses compressible data.
Certain SSD controllers can process compressible data more efficiently.
As a result:
- ATTO scores may appear higher
- Real-world workloads may not always achieve those numbers
This is one reason published specifications often closely resemble ATTO results.
AS SSD Benchmark: A More Realistic Approach
AS SSD was designed specifically for testing SSD performance.
Unlike ATTO, it uses incompressible data.
Why This Matters
Many real-world files cannot be compressed effectively:
- Photos
- Videos
- Encrypted files
- Game assets
Testing with incompressible data often provides a more conservative and realistic performance estimate.
Typical Results
An SSD that achieves:
- 7,000 MB/s in CrystalDiskMark
might show:
- 6,300 MB/s
- 6,500 MB/s
in AS SSD.
This doesn’t mean the drive is slower.
It simply reflects a different testing methodology.
Why Benchmark Results Differ So Much
Several factors contribute to benchmark variations.
1. Different Data Patterns
Some benchmarks use:
- Compressible data
Others use:
- Incompressible data
This can dramatically affect results on certain controllers.
2. Different Queue Depths
Testing at QD1 often produces very different results compared to QD32.
A drive optimized for high queue depth workloads may appear stronger in synthetic benchmarks than in everyday desktop use.
3. Different Block Sizes
Performance can vary significantly depending on whether the benchmark uses:
- 4 KB
- 64 KB
- 1 MB
transfer sizes.
4. SLC Cache Behavior
Modern SSDs often use an SLC cache.
During short benchmarks:
- Data fits inside cache
- Performance appears extremely high
During long transfers:
- Cache fills
- Performance may decrease
This is why sustained write testing can produce very different results.
5. Thermal Conditions
Temperature affects SSD performance.
As temperatures increase:
- Controllers reduce speed
- Thermal throttling activates
A benchmark performed on an open-air test bench may differ from one conducted inside a compact system.
6. Platform Differences
SSD performance can also be influenced by:
- CPU
- Motherboard
- PCIe generation
- BIOS settings
- Operating system
The same SSD may produce different results on different systems.
Synthetic Benchmarks vs Real-World Performance
One common mistake is assuming benchmark scores directly translate into user experience.
Consider two SSDs:
| SSD | Sequential Read |
|---|---|
| SSD A | 7,000 MB/s |
| SSD B | 5,000 MB/s |
Many users assume SSD A will feel dramatically faster.
In reality:
- Windows boot times may differ by only a second or two
- Game loading times may be very similar
- Application launching may show minimal differences
Why?
Because real-world responsiveness often depends more on:
- Random performance
- Latency
- Controller efficiency
- Firmware optimization
than on peak sequential throughput.
What Specifications Actually Matter in 2026?
When evaluating an SSD, consider more than just advertised speed.
Important factors include:
Controller Quality
The controller acts as the SSD’s processor.
It affects:
- Stability
- Latency
- Thermal behavior
- Sustained performance
NAND Flash Quality
Different NAND types influence:
- Endurance
- Reliability
- Long-term consistency
Sustained Write Performance
Especially important for:
- Video editing
- Content creation
- AI datasets
- Backup operations
Thermal Design
Higher speeds often generate more heat.
Effective thermal management helps maintain performance under load.
Firmware Optimization
Well-optimized firmware can significantly improve responsiveness and consistency.
How to Interpret SSD Benchmark Results Correctly
When comparing SSDs:
✅ Look at multiple benchmark tools
✅ Consider both sequential and random performance
✅ Check sustained performance tests
✅ Read real-world usage reviews
✅ Evaluate reliability and consistency
Don’t focus exclusively on a single benchmark screenshot.
Final Thoughts
SSD benchmarks are valuable tools, but they only tell part of the story.
CrystalDiskMark, ATTO, and AS SSD each measure performance differently, which is why the same drive can produce different results across tests.
Understanding these differences allows users to make more informed decisions and evaluate storage products more accurately.
The fastest benchmark result does not always guarantee the best user experience. In many cases, factors such as latency, sustained performance, thermal behavior, controller quality, and firmware optimization play a much larger role in everyday computing.
As SSD technology continues to evolve in 2026, looking beyond headline speeds remains one of the best ways to choose the right storage solution.